The Distinctive Brand Asset Grid is one of the main visual aids used in Distinctive Asset research. A version of the Distinctive Brand Asset grid was first developed and used by Jenni Romaniuk of the Ehrenberg Bass Institute, as a way of plotting how distinctive assets scored against key distinctiveness metrics. It is a simple but very powerful visual aid, with an assets position on the grid telling a different story depending on which quadrant it falls into, and indeed where in that quadrant it lies.
Below is a Distinctive Asset Grid which comprises of two key metrics:

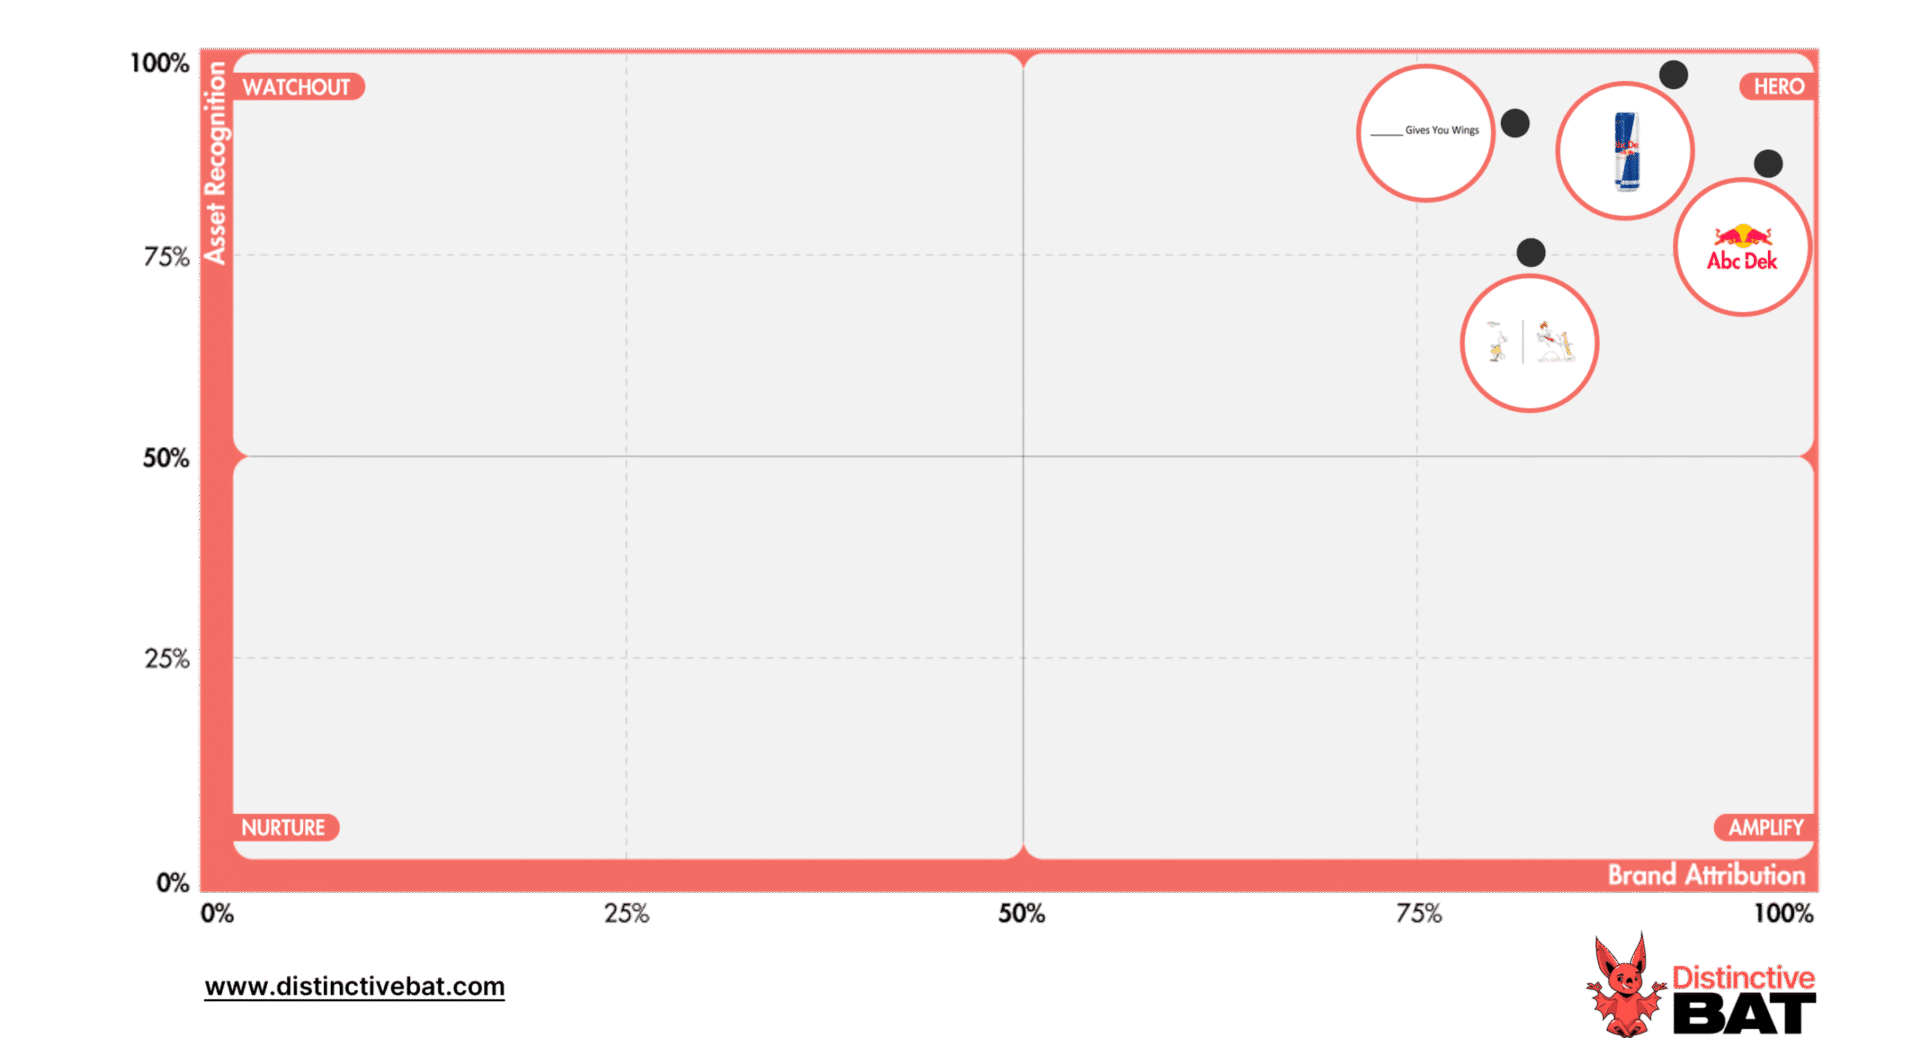
Assets in the Hero quadrant are recognised by at least 50% of category buyers as belonging to a brand in that category (Asset Recognition), with at least 50% correctly attributing it to the brand (Brand Attribution).
Needless to say, this is where you want to appear! The closer an asset lands to the top right corner, the stronger and more hard-working it is.
Below is an example from Red Bull, a very distinctive brand with some brilliant assets. Both their can and logo score so high they are of an iconic nature. The can itself works as a reach driver, on the shelf and in hand, it continuously drives salience by simply reminding people the brand exists. The tagline also performs very well, a rare feat for this asset type, with the consistent use and synergy with their advert style no doubt driving the asset’s high Brand Attribution.

This is quite a nuanced space on the Distinctive Asset Grid. Assets that fall here are well recognised but potentially not for the right reasons. They may be category generic in that they feel very familiar but lack attribution to any brands or indeed worse, they could be triggering a competitor. Assets that fall here, especially those closer to the left-hand side axis, are likely difficult to own and may require further support. However, the assets in proximity to the Hero quadrant may transition into Hero assets with the correct application.
Below you will see several Nespresso assets plotted. Some assets such as the capsules and packaging score relatively well. The introduction of the new Vertuo range (larger capsules) by Nespresso is likely diluting the scores between the old and new. As the old capsules are phased out, and the brand focuses all its energy on Vertuo, these will likely become Hero assets. Meanwhile, the cup and advert style fall into an awkward space. The cup is somewhat category generic, unsurprising in many ways as so many coffee brands use similar cup shapes, while Nespresso themselves don’t seem to focus on only one cup or shape. The advert style is also not screaming Nespresso, as seen by the low Brand Attribution.

Assets that fall in the Nurture quadrant (bottom left) are not yet well known amongst category buyers and don’t feel familiar. They also have limited levels of correct Brand Attribution. Assets that fall into this quadrant could yet become distinctive assets of note through a concrete plan and the right application. There can be many reasons why assets fall here, some might be new and just haven’t been seen by enough people yet (for these types of assets we would also unpick misattribution data to see if there are potential challenges with ownership to competitors). On many occasions, assets that fall here have just not been given enough prioritisation or applied creatively enough for them to stand out. For some assets, the poor performance can also be down to the type of asset. Certain asset types like taglines are just really difficult to embed amongst the masses and often don’t play a distinctiveness role for the brand.
Assets in the Amplify quadrant are generally those that are hardworking DBAs, with good levels of distinctiveness but are less well known by the wider category consumers. Assets that fall here are distinctive assets that perform well amongst a smaller subset of category buyers, perhaps a brand's key audience, or amongst a younger cohort. Their wider visibility may be limited, potentially due to media targeting, or if the brand/product is playing up to a niche audience.
Below is a Distinctive Brand Asset Grid example of ad style from the Barbie movie, which tested well from a Brand Attribution perspective, but at lower levels of recognition amongst the wider public. The ad performed much better amongst the core audience of Females aged 16-24YO, with this younger female audience driving a lot of the Brand Attribution uplift (More on Barbie here).

These are just some examples of how we use the Distinctive Brand Asset Grid, amongst other visual aids, in our client reporting. If you would like to learn more about the grid, or how this type of research could fuel your brand performance, please drop us a line.